
The Scenario Discussed in my blog post Stay Put looks more and more likely: that pressure on government officials to let businesses “open back up” is growing, and it’s way too early for that.
The badly named “social distancing” (we need to be social; as Mike suggests in one of his stories this week it’s “physical distancing” that’s important!) truly has worked to blunt the rate of infection, keeping the death rate way down while we wait for a vaccine. Stop the isolation too soon and infections will shoot up, as we’ve seen before. If you’re not already aware of how easy is it for a few sick people to create a huge number of infections, read this article: How a Premier U.S. Drug Company Became a Virus ‘Super Spreader’. It’s sobering. If politicians do something stupid like let our guard down too early, I highly recommend “staying put” for a couple weeks anyway to see what happens.
The idea is not to scare anyone, but to give you some facts to ponder so you can make informed decisions. Consider New York (state), population around 19.5 million. Gov. Andrew Cuomo said on March 17 that New York City wouldn’t quarantine — “That cannot happen.” Three days later Mayor Bill de Blasio said the city was “now the epicenter of this crisis” in the U.S., with 5,151 cases and 29 deaths. Four days after that, Cuomo noted there was an “astronomical” surge of cases in the city, with new cases doubling every three days. Today, New York (state) passed 10,000 dead from more than 195,000 cases.
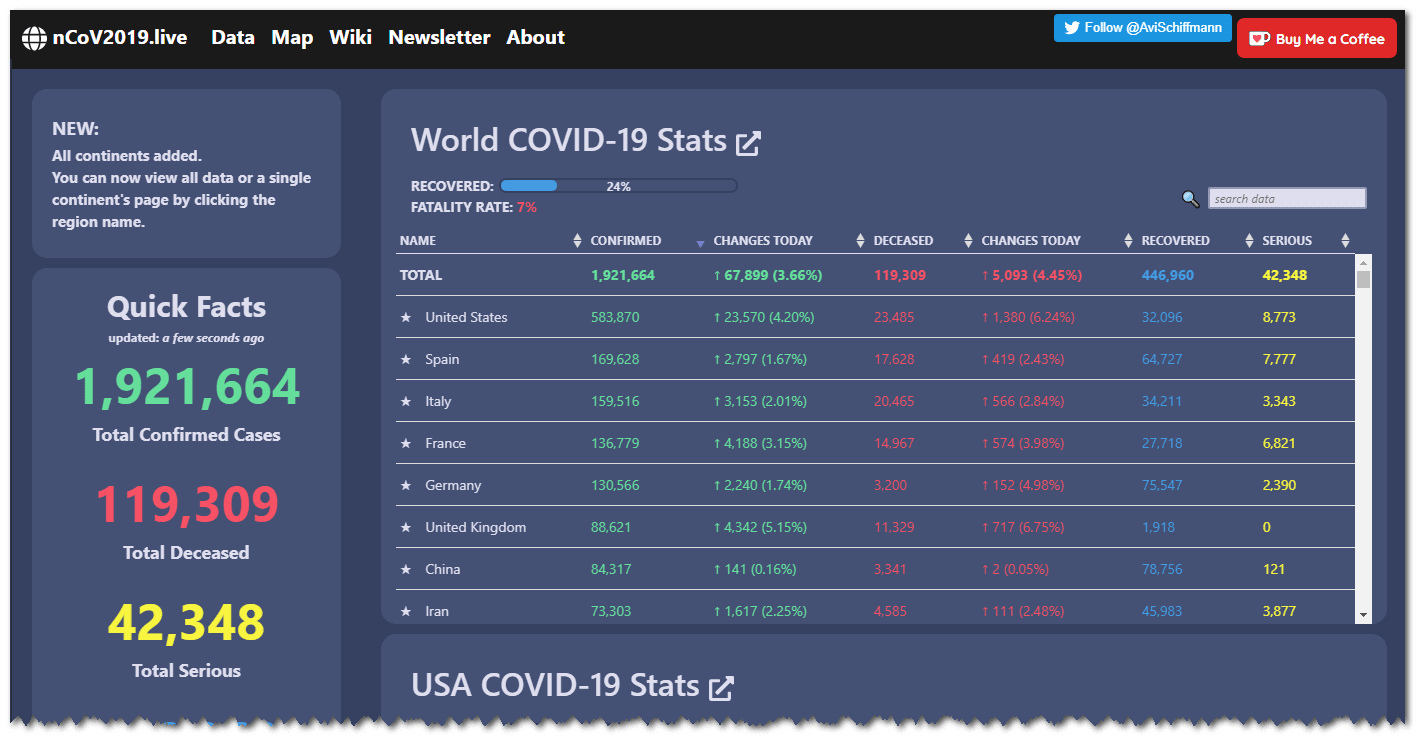
Compare that with California, population around 39.5 million, which issued a state-wide “stay at home” order on March 19. Today, California has just short of 700 deaths from 23,428 cases. Yeah, I know what you’re about to say: “But Randy, the people of California are spread out over a MUCH larger state!” Yep: pretty much proves the point. I urge you to stay home and avoid all contact with people who you “don’t know where they’ve been.” Meanwhile, I don’t believe the numbers out of China (3,341 dead out of 84,317 cases): I think they’re way under-reporting what really happened there. Wuhan has around 11 million residents; New York City has about 8.4 million.
Friday Update
(Evening of 17 April 2020): New York (state) has passed 16,000 dead — yes, up 60 percent in four days — out of more than 226,000 cases. California: 949 dead from 27,500+ cases.
Meanwhile, to my suspicion of China “under-reporting” their numbers: today (April 17), CNBC reported that China’s official news agency “has revised upwards the numbers of confirmed coronavirus cases and deaths” in Wuhan, the city of origin of the virus, after “a city-wide investigation.” While infections only went up by 325 (to 50,333 cases), deaths jumped by 1,290 (to 3,869). My gut feeling is the numbers are still under-reported. (Source)
Source for the infection/death figures: ncov2019.live. Also see the very interesting and very comprehensive Timeline of the Coronavirus Pandemic and U.S. Response from JustSecurity.org, a non-profit based at the Reiss Center on Law and Security at the New York University School of Law. The page is still being updated. Last, check out this fascinating moving chart that compares the rate of COVID deaths with the usual top 15 causes of death in the U.S. Mind-boggling!
Covid vs. US Daily Average Cause of Death
By Alex Estrella on 8 Apr 2020
The Chart Animation apparently runs before you can scroll down the page. Click the black button in the very lower left to start it over. Note you can also pause it and move the pointer to where you want, and stay still.
– – –
Bad link? Broken image? Other problem on this page? Let Me Know, and thanks.
This page is an example of my style of “Thought-Provoking Entertainment”. This is True is an email newsletter that uses “weird news” as a vehicle to explore the human condition in an entertaining way. If that sounds good, click here to open a subscribe form.
To really support This is True, you’re invited to sign up for a subscription to the much-expanded Premium edition.
About the Chinese COVID-19 case numbers. China is an authoritarian state. When they finally woke up to the danger and clamped down, they really clamped down in a way we just can’t in the western world.
It’s quite plausible to me that they were able to contain it given the drastic measures they took. I told my wife at the time, as we quickly headed back to Canada from Florida, that the USA, and the western world in general, was going to be much worse because we just can’t clamp down that hard. So far, the claim is around 88,000 cases in China for about two billion people versus over half a million cases so far in the USA with a population of 325 million.
Try to imagine a New York City being clamped down by a Chinese government. Nobody but essential workers would be allowed outside. At all. Food and essential supplies would be delivered to your door by the government. Picture that, and you can easily see that there would be far fewer cases in NYC than there are today. But we in the western world wouldn’t put up with that. At least, not for a mere 1-2% fatality rate. 🙂
—
Oh, I definitely agree that China’s numbers would be much higher if not for their drastic action. I just don’t believe even the more up-to-date numbers from my stated source reports all the known cases. -rc
I can’t really argue with your response. We simply don’t know whether they’ve revealed all the numbers.
Interestingly, we have our own challenges in the western world because we’re limited in our testing. So, we don’t even know our own numbers with any precision.
You have to do a whole lot of testing — like five or ten percent of the population — and repeat it daily or weekly to get a true idea of what your infection rates actually are, and then you can calculate fatality rates.
Finally, regarding fatality rates, if you only test dead people, you’ll find a 100% fatality rate. If you don’t bother testing dead people (or those about to die) because you can’t help them any more, then your fatality rate will be zero. So you have to ask about testing policies before you can put faith in the numbers.
To go from thousands to zero (not three or four, zero) suggests that some of that pressure was applied to people who might otherwise have found and reported a case.
That chart scared the **it out of me.
And seeing the white house muttering about opening business back up soon, really added to it. Considering he didn’t want to shut down at all originally. And the pres retweeting calls to fire Dr fauci scared me more.
That’s a great idea, get rid of a competent medical professional for political reasons and go against sound medical advice. That always ends well, right?
10,411 cases in Washington State as of yesterday (My home). And we still have morons going to beaches, parks, etc., and bitching about the lockdown.
While I agree with the need to keep the country on as much of a lock down as we can to stop the spread of the disease, we will soon start to see a problem with distribution of food and other necessary supplies. Farmers and ranchers are already having to get rid of fresh produce and milk that they cannot send to stores in the bigger cities, while food banks in these cities are running out of food. And if the farmer can’t sell the crops that he has just harvested, how will he buy more seed for the next harvest. I don’t believe that we can survive long enough on the food that is already in the cities for this to come to a peaceful end. When enough people have run out of food, there is nothing the government will be able to do to keep the peace.
—
I don’t think it’s going to get that bad. There’s a lot of food in the distribution pipeline. -rc
The death rate comparison is apples to oranges. Comparing a daily average (any of the 365 days in a year) to a daily total is poor methodology, because they are not both averages.
For example, 10,000 divided by 365 is 27.4. This would be an apples to apples comparison.
Yet, I’m no statistician, so maybe I misunderstand something.
—
You can’t divide by 365 since it’s been nowhere near that long yet. Simply, the visualization is just ONE tool for putting things into context. It’s certainly not the only tool. -rc
I was the facility coordinator for Ebola management during that outbreak. I am still amazed at how well we mobilized the entire healthcare system in a matter of weeks to handle the anticipated disaster. Corporate leaders convened action teams that were trained up to manage each facility. At my hospital the ED staff were all trained in decontam procedures and CDC isolation standards, as well as specimen collection and management, within 4 weeks. We had portable decontamination receiving stations that could be stood up at the ED patient entrance in less than 30 minutes; we converted an entire pod in the ICU and two immediately adjacent ED beds to a full-fledged biohazard containment zone with independent air and water control in 10 days (damn good facility director of engineering). We ran IRL drills, not table tops, weekly. There were daily conference calls to report progress and obstacles to senior leadership. The CDC bulletins were required reading for all physicians and staff at the facility. And this was at both facilities of a dual campus acute care Med/Surg hospital with a separate OB/GYN specialty hospital!
It seems that, looking at the current disjointed response across the country, that we got contemptuously complacent when Ebola didn’t arrive as the Horseman of Pestilence we thought it would be. Politics, ideologies, and gut feelings have replaced rigorous critical thinking and science.
Keep doing what you do and be safe.
—
Ebola didn’t arrive in force because of the preparation and containment work you and people like you did. And that’s the sad thing: when “nothing happened” fools thought you overreacted, rather than giving you the credit you deserved for stopping it. -rc
About the comparison chart, remember the CDC is counting any death with any association with COVID-19 as caused by the virus. This would apply even if the person died in a car crash after testing positive. I still believe most of the deaths are from an underlying health issues like obesity, hypertension, or diabetes giving the compromised immune system less chance against the effects of the virus. Until the cause of death is “something” and COVID-19 we will not know the true mortality rate of the virus.
—
I’ve heard this claim before, and it’s not true that if there is “any association” with COVID-19 that “per the CDC” a death is considered “caused by” COVID-19.
In its “Guidance for Certifying Deaths Due to Coronavirus Disease 2019 (COVID–19)”*, the CDC makes it clear that when COVID-19 is part of the circumstances leading to death, it should be listed just as any medical condition that is “part of the sequence” leading to death has always been necessary to be reported on a death certificate.
“Other significant conditions that contributed to the death, but are not a part of the sequence in Part I, should be reported in Part II. Not all conditions present at the time of death have to be reported — only those conditions that actually contributed to death.” (emphasis, here and in quoted sections below, added)
When should COVID-19 be mentioned as a contributory or proximal cause on a death certificate? “When reporting cause of death on a death certificate, use any information available, such as medical history, medical records, laboratory tests, an autopsy report, or other sources of relevant information. Similar to many other diagnoses, a cause-of-death statement is an informed medical opinion that should be based on sound medical judgment drawn from clinical training and experience, as well as knowledge of current disease states and local trends.” In other words, not just a guess, not because “there’s COVID in the community,” or other such nonsense.
Also, “Ideally, [when COVID-19 is suspected] testing for COVID–19 should be conducted, but it is acceptable to report COVID–19 on a death certificate without this confirmation if the circumstances are compelling within a reasonable degree of certainty.“
Last, note the word in the document’s title: “Guidelines”. The CDC cannot and will not force a state (or any medical examiner in any state) to put anything on a death certificate that the certificate’s signer is not convinced is true, nor can they go in and change any death certificate even if for some unfathomable reason they wanted to, no matter what the “conspiracy theorists” would have you believe.
*(Source)
Thanks Randy. It was a comment I heard from one of the White House briefings that seemed to imply that was the way they were looking at the numbers. I should have done more research on the subject myself.
—
Sadly, we can’t rely on politicians to give us the truth. We need to listen to the people who have dedicated their lives to epidemiology, and study and work with it and their fellow experts daily. -rc
Another major cause of the rise in infections in NYC was that the subways were not shut down soon enough. Those people crammed up against each other and breathing the same air with no filtering must have spread the virus very quickly. Does California have any subways? It has the BART around SF, but was that running after the stay-at-home was issued?
I live in Texas in a sparsely populated county (Llano) and we had 3 cases total. Can we re-open now, or must we stay locked down like Houston and Dallas? Most of the work here is in agriculture. The cows need feeding and the pastures need weeding.
Interestingly, studies on the genetic mutation of the virus released this week from Cambridge University and Stanford suggest that the origin and spread of the virus may have started as early as Sept. 18, not late January as current media reports have indicated. If this is so, then much of the lockdown/stay-at-home drama may have been unnecessary, or at least too late in coming. Can we agree that much of the reaction of our “leaders” has been driven as much by media attention/perception as by informed science?
And John, quoting the CDC’s guidelines about how COVID-19 deaths should be counted isn’t the same as certifying that those guidelines were actually followed. New York, for example, has admitted that they changed the way deaths were counted, resulting in a higher figure. This may or may not be an accurate counting…the debate will rage on…but the higher count certainly provides political cover to those who seized power and shut down the country. Lesser figures would leave them open to even greater criticism for an “overreaction.”
—
The conclusion that “it was here earlier so we didn’t need to lock down later” is absurd. Stupid theories that lay people pull out of their butts are killing tens of thousands of people. (Note that doesn’t say “may kill” but rather “are killing.”)
Two actual epidemiologists (Britta L. Jewell, a research fellow in the department of infectious disease epidemiology at Imperial College, London, and Nicholas P. Jewell, chair of biostatistics and epidemiology at the London School of Hygiene and Tropical Medicine, and a professor at the University of California, Berkeley) write that “an estimated 90 percent of the cumulative deaths in the United States … might have been prevented by putting social distancing policies into effect two weeks earlier, on March 2, when there were only 11 deaths in the entire country. The effect would have been substantial had the policies been imposed even one week earlier, on March 9, resulting in approximately a 60 percent reduction in deaths.” (emphasis added. Source)
Yes; I was/am confused. It’s an interesting graphic, but I haven’t found out what those figures are — daily ? annual ?
Also, we now find that in the UK, deaths outside hospitals are not included!
—
The chart’s linked source has a title that isn’t included in the embed that makes it very clear: daily. I’ve copied the title over so that’s clear here, too. And your last sentence illustrates just how under-reported these deaths really are. -rc
That chart does look scary. However, I assume it’s comparing the top 15 _average_ number of deaths per day, to Covid’s actual number of deaths on a certain day.
For a lot of those causes that probably makes sense. But the common flue comes in epidemics too, so it will also have a large spike in daily deaths. How is that spike comparing to Covid’s so far? Is that known?
—
Yes, the chart titled “Covid vs. US Daily Average Cause of Death” shows each day’s Covid death rate vs the US Daily Average Cause of Death. As far as showing the average for flu, the does chart have a line for “Influenza&Pneumonia”, but doesn’t break it down further than that. -rc